Mid-October 2026 Market Report: Indiana Sales Fall 4% as Rates Hold at 7.40%
Indiana's October 15 report showed closed sales down 4% year-over-year as the 30-year fixed mortgage rate held at 7.40%, its highest level since late 2023. Here is the mid-October 2026 market report for Hamilton and Boone County buyers and sellers, including what to watch ahead of the Federal Reserve's October 28 decision.

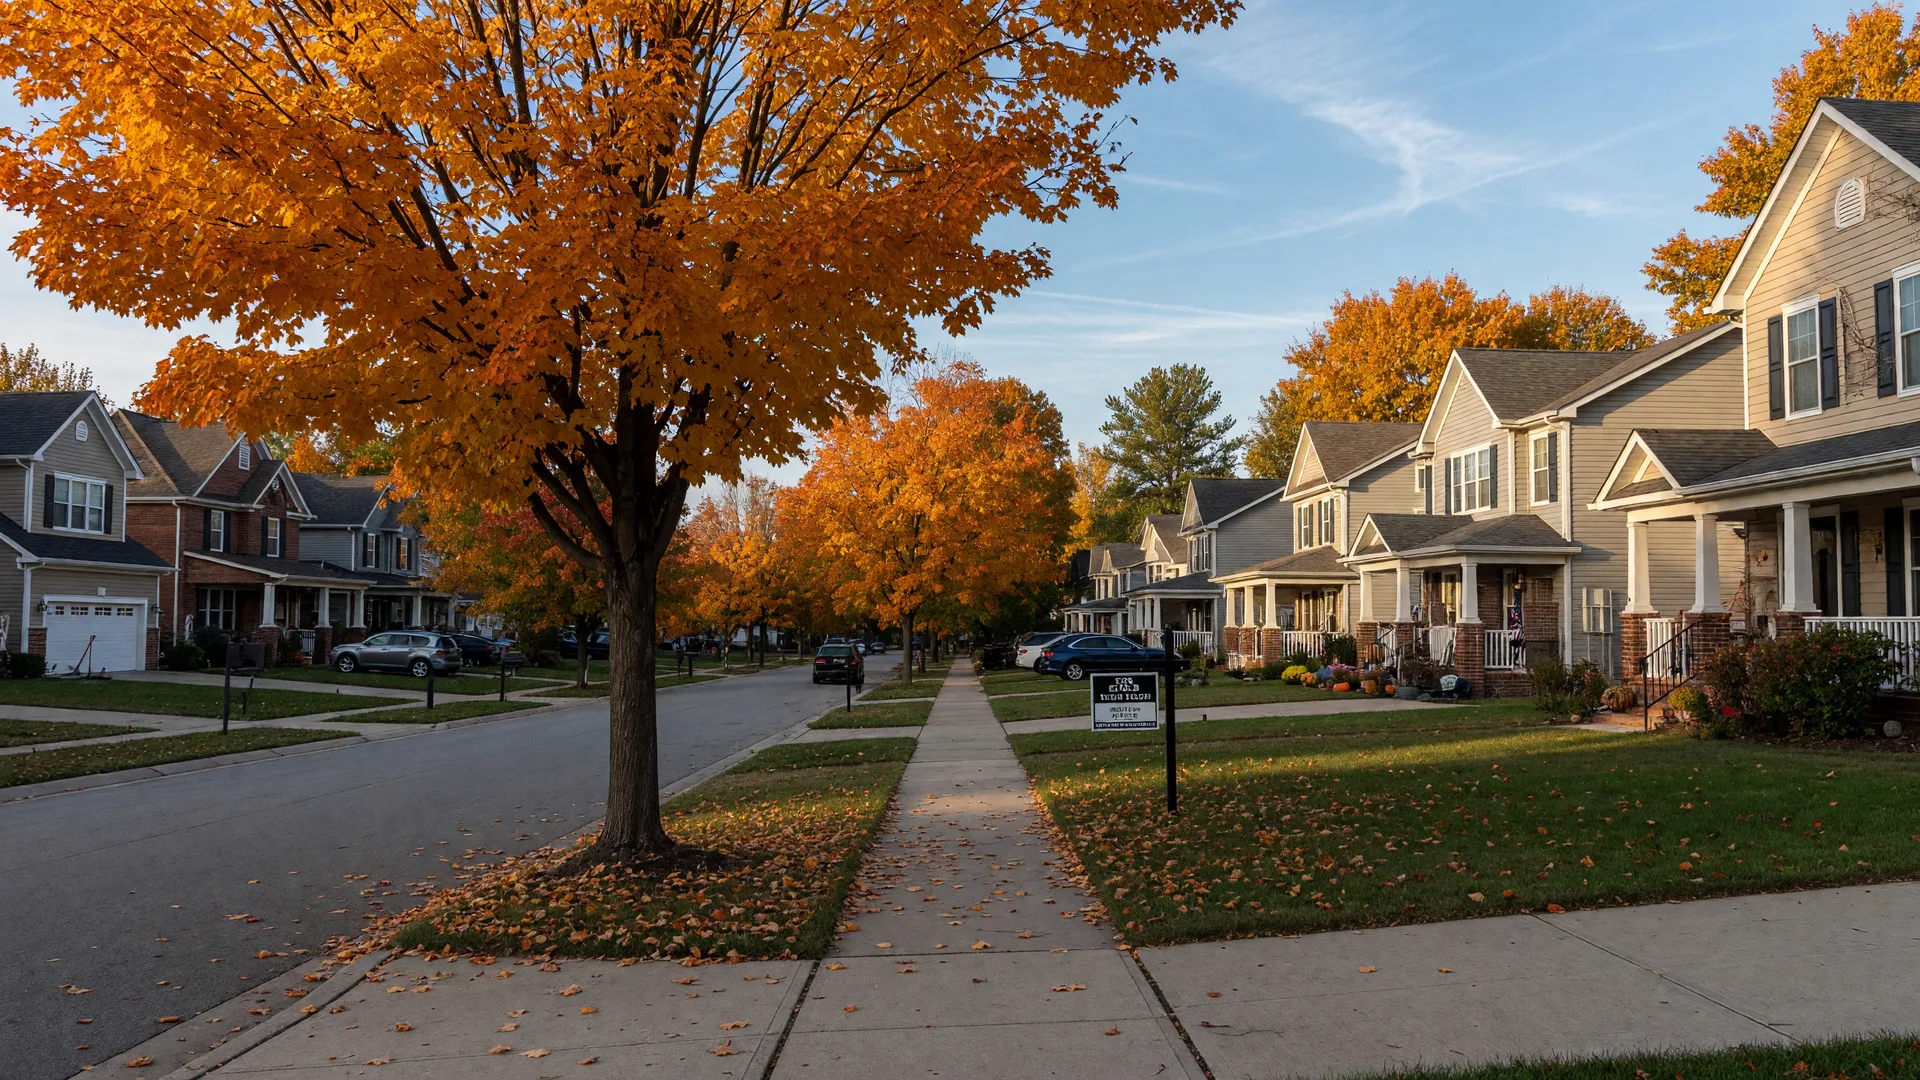
Indiana's housing market is officially feeling the weight of higher mortgage rates. The Indiana Association of REALTORS reported Thursday, October 15 that closed home sales fell 4% year-over-year to 7,203 closings, with the association's leadership pointing directly at two months of rates running above 2025 levels and sending some buyers to the sidelines. The same week, Freddie Mac's weekly survey put the 30-year fixed mortgage rate at 7.40%, unchanged from the prior week and the highest reading since late 2023.
The local picture is steadier than the headline suggests. Median prices across Indiana and central Indiana have held their gains, Hamilton County's active listings recently topped 1,000 for the first time since 2023, and Boone County's Zionsville and Whitestown continue to attract buyers who want top schools without an urban commute. Deep inventory and patient pricing have quietly turned this into one of the most balanced markets the region has seen in years, even as the rate headlines stay stubborn.
This report walks through the numbers released this week, the calendar that matters between now and the Fed's October 28 decision, and what buyers and sellers across Fishers, Carmel, Noblesville, Westfield, Zionsville, and Whitestown should actually do about it. As an Associate Broker who works all six cities daily, I am watching these reports with one question in mind: what does this mean for a specific family making a specific move this fall?
The Rate Picture: 7.40% Holds for a Second Straight Week
Freddie Mac's Primary Mortgage Market Survey for the week ending October 15, 2026 put the 30-year fixed mortgage rate at 7.40%, unchanged from the week before and the highest reading since late 2023. The 15-year fixed rate averaged 6.71%, down two basis points from the prior week. A year ago, the same 30-year survey averaged 6.27%, which puts the current gap of more than a full percentage point in perspective.
The plateau, rather than another jump, is the notable development. After seven consecutive weekly increases from Labor Day through the first week of October, the market spent this week catching its breath. Local loan officers I speak with are seeing the same pattern: buyers are financing at 6.75% to just over 7% depending on points and program, and seller-paid buydowns have moved from a nice-to-have to a near-standard negotiating term on resales across central Indiana.
National: Sales Rebound Slightly, But Builder Sentiment Slips to a One-Year Low
The National Association of REALTORS reported September existing-home sales up 1.5% to a seasonally adjusted annual rate of 3.99 million on October 13, a modest rebound from the 3.98 million August pace, with a 4.8-month supply and the median existing-home price up 1.3% year-over-year. Sales remain down on a year-over-year basis, which is exactly what the rate environment would predict.
The builder side of the market is more cautious. The NAHB/Wells Fargo Housing Market Index came in at 32 for September, down three points from 35 in August and the lowest reading since September 2025, as builders cited higher mortgage rates, tight lending conditions, and elevated land, labor, and construction costs. The October HMI releases Monday, October 19, and it will be the first fresh sentiment reading since rates leveled off, so it is worth watching for any sign that the plateau is stabilizing builder confidence.
The September new-residential-construction report from the Census Bureau and HUD lands Tuesday, October 20. The last reading showed August housing starts at a seasonally adjusted annual rate of 1,275,000 with building permits at 1,394,000, about 2.7% below July's 1,433,000. A soft September starts print would reinforce the story builders are telling in the HMI, while a stronger one would hint that rate incentives are doing their job.
Indiana: Sales Soften While Inventory Hits a 31-Week Run
The Indiana Association of REALTORS reported Thursday, October 15 that closed home sales across the state fell 4% year-over-year to 7,203 closings. The association attributed the pullback to mortgage rates running above 2025 levels for two straight months, an unusual stretch that has put some buyers on the sidelines even as prices hold firm. The flip side of softer sales is a healthier selection: statewide inventory has now grown for 31 consecutive weeks, with average daily listings near 7,205 in the week of October 5.
Central Indiana mirrors the state with bigger local numbers. WISH-TV reported October 13 that buyer demand across the region has been dampened by rates near 7.5% locally, the second-highest level in 25 years, while median prices have stayed steady. MIBOR's most recent report showed central Indiana inventory up 17.8% year-over-year during the summer, and the September county report that follows should confirm the same pattern with an even deeper autumn selection.
What durable full-year records sit behind this slowdown? Indiana's statewide median sale price hit an all-time high of $290,000 in June 2026 after first-half closed sales ran about 2.5% above 2025. Prices have cooled in pace but not reversed, which is the crucial distinction: this is a market hitting a high plateau, not a falling one. For buyers, that means the same price levels with far more negotiating room than any of the past four years.
Hamilton County Holds Its Premium While Inventory Crosses 1,000 Active Listings
Hamilton County's September numbers, published on my Market Report page, showed the countywide median sale price at $487,000 with price per square foot at $190 and active listings at 1,009, the most since 2023. The year-to-date median sits near $474,900, the highest of any central Indiana county, and the premium neighborhoods of Carmel, the lake-adjacent corners of Fishers, and the newest Westfield construction corridors keep commanding the strongest demand.
Boone County rides on the strength of its two stars. Zionsville's three-month median holds near $750,000, up more than 5% year-over-year, with Zionsville Community Schools and the brick-paved village justifying the premium. Whitestown keeps selling new construction at a steadier price point for buyers who want Boone County schools without the Zionsville sticker, and its 55+ pipeline continues to grow with Beckman Park moving toward launch.
What this means on the ground right now: more tours available, more days on market, and more sellers willing to negotiate concessions than at any point in years. The cream of every neighborhood still moves quickly, and off-market activity remains strong in the resort-style communities, but the days of five-offer weekends are over. That is a healthier market for everyone, and it rewards buyers who are prepared and sellers who price to today's reality.
What Buyers Should Do in a Plateau-Rate Market
Treat the plateau as a planning window
Rates have stopped climbing for now, which gives buyers a rare chance to move without chasing a moving target. The FOMC meets October 28, and whether the Fed signals more hikes or holds, mortgage rates will respond. If you are pre-approved and ready, the next two weeks are a window to tour, negotiate, and lock before the next market-moving headline. My team pulls current rates and lender programs before we tour, so we compare apples to apples.
Make concessions and buydowns work harder
With 31 weeks of growing inventory behind us, seller-paid closing costs and rate buydowns have become the deal-sweetener of this market. A seller contribution that trims your first-year or two-year payment can do more for your monthly budget than waiting for a quarter-point rate drop that may not arrive before spring. The affordability guide on this site walks through the full payment math with taxes, insurance, and HOA dues included.
Use the deep inventory to negotiate condition, not just price
The deepest selection in years means buyers can ask for inspections, repairs, and closing flexibility instead of waiving everything. Nearly every conversation I have this month includes a repair request or a closing-date concession, and sellers are saying yes more often than not. A prepared buyer with a strong pre-approval is in the driver's seat in a way that has not been true since before the pandemic.
Go where the inventory is, including off-market
In the hottest Hamilton County neighborhoods, the best homes still move before they hit the public feeds. Off-market listings, pre-listing outreach to owners, and direct seller conversations have helped my buyers land homes that never appeared online. When other buyers are rate-shy, a prepared buyer with an off-market pipeline has an unusual edge in exactly the neighborhoods everyone else is waiting to buy into.
What Sellers Should Do With 1,000-Plus Listings on the Market
For sellers, the message in the mid-October data is simple: price to today's market, not to 2021. Homes in Hamilton and Boone County are still selling, and premium properties in the best districts are still drawing qualified offers, but the buyers who remain are more deliberate. They compare, they ask for concessions, and they walk away from listings that feel stale.
October and November are calm power months for sellers. The buyers active right now are serious, many motivated by relocation timing or a year-end closing, and with 1,009 active listings in Hamilton County, a well-priced and well-presented home stands out against a lot of competition. Fresh paint, decluttered rooms, and professional photography still separate homes that go under contract in days from homes that sit through the holidays.
If you have been weighing a move but hate the idea of trading a low-rate mortgage for today's 7.40%, remember that today's buyers negotiate seller concessions precisely because your position can be part of the deal. A local agent who knows the comps, the concession structure, and the buyer pool in your specific neighborhood is worth far more than a national forecast. If you want to talk numbers, call or text me at 317-777-9146 anytime.
The Buy Now or Wait Question Around the October 28 Fed Meeting
The Federal Reserve meets October 27 and 28, with the policy statement due Wednesday afternoon. The September projections showed a median expectation of 4.1% for the federal funds rate at the end of 2026, after the Fed's September 16 hike to a 3.75% to 4.00% target range, its first increase since July 2023. Mortgage rates track long-term Treasury yields more than the fed funds rate directly, so the market will respond to whatever the Fed signals about the path ahead, not just the headline decision.
Here is the honest version: nobody knows exactly where rates go after October 28, and I will not pretend otherwise. What we do know is that waiting has a real cost in this specific market. Local inventory is the deepest in years, negotiating leverage is genuinely with buyers, and when rates eventually ease, history says demand returns quickly and that leverage evaporates. Buyers who moved into today's market are often the ones securing concessions, avoiding bidding wars, and locking in homes with payments they can live with.
My advice to clients is to run the math both ways: what a purchase costs today at 7.40%, and what the same purchase would cost if rates fell a full point next spring, including the difference that buying now with leverage and concessions makes. Numbers, not headlines, should drive the decision.
The national number is the same for everyone. Your payment, your neighborhood, and your negotiating position are local. That is the difference a local agent makes.
Sources
Freddie Mac Primary Mortgage Market Survey, week ending October 15, 2026, and year-ago comparison. Indiana Association of REALTORS statewide sales and inventory report, October 15, 2026, and mid-2026 Indiana housing data. National Association of REALTORS Existing-Home Sales report, September 2026, released October 13, 2026. NAHB/Wells Fargo Housing Market Index, September 2026, with October 19, 2026 release scheduled. U.S. Census Bureau/HUD New Residential Construction, August 2026 (starts and permits), with September data scheduled October 20, 2026. Federal Reserve FOMC meeting calendar and September 2026 Summary of Economic Projections. F.C. Tucker Company / MIBOR central Indiana and Hamilton County market reports, September 2026. WISH-TV central Indiana market reporting, October 13, 2026. Market data as published on the EverythingHamiltonCounty.com Market Report page.
Mortgage rates change daily and vary by lender, credit profile, loan program, and down payment. Verify current rates, pricing, and incentives directly with a lender or a licensed local real estate professional before making decisions. This article is for informational purposes only and is not financial advice.
Ready to Turn This Market Report Into a Strategy?
Whether you are buying, selling, downsizing, or just curious what your home is worth at today's rates, let's put the real numbers together. I work Fishers, Carmel, Noblesville, Westfield, Zionsville, and Whitestown every day, and I will give you a straight answer.