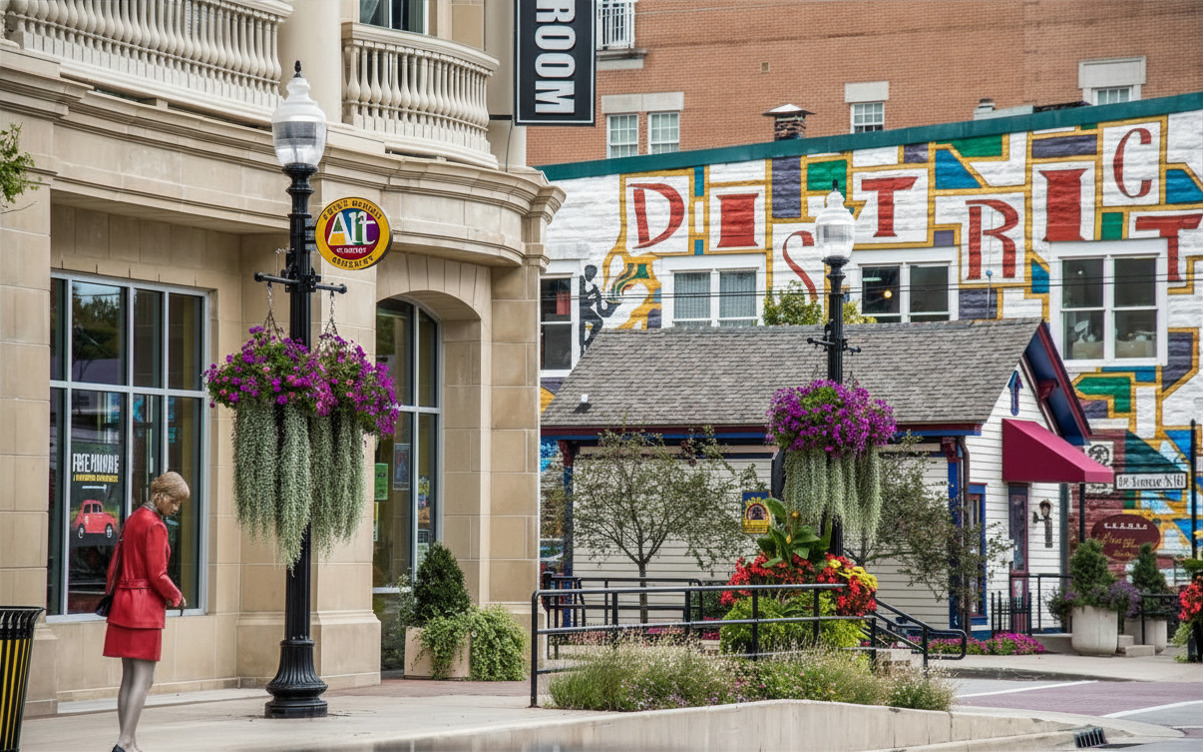
Hamilton County
Market Report
A comprehensive, city-by-city snapshot of median home prices, days on market, active inventory, and year-over-year trends across Hamilton County's six key communities.
September 2026 Market Update
Hamilton County, Indiana September 2026 stats: closed sales, new listings, active inventory, days on market, and pricing at a glance.
September market update video
Previous Market Updates
Past months' market updates and videos, newest first.
 August 2026
 August 2026 Market Update
County median $520,500, 818 active listings, 1.2 months of supply, and 659 closed sales in June.
August 2026 Market Update
County median $520,500, 818 active listings, 1.2 months of supply, and 659 closed sales in June.
August 2026 Market Update
Watch Susan's August update on what's happening in the Hamilton County housing market.
Hamilton County at a Glance
Latest available data as of the August 2026 update: June 2026 MIBOR county report, F.C. Tucker July 2026 Market Watch, Freddie Mac September 2026 readings.
What the Latest Numbers Mean
Five things to know about Hamilton County's housing market right now.
Prices keep climbing at a steady pace
The county median hit $520,500 in June 2026, up 3.7% year over year. Solid, sustainable appreciation.
Inventory is near a decade high
Central Indiana listings are up about 20% year over year, and county supply loosened to 1.2 months. Buyers have real choice again.
Rates crossed 7% in late September
The 30-year fixed averaged 7.03% the week ending September 24, 2026, up from 6.65% in late August. Leverage is shifting to buyers.
Sellers need pricing discipline
County average days on market rose to 30 in June. Well-priced homes still sell fast; overpriced listings settle for price cuts.
Buyers' best window in years
More listings, a slower pace, and motivated sellers add up to the most favourable buying climate in almost a decade.
Quick Comparison Table
Compare all six communities at a glance before diving into the detailed city profiles below.
| City | Median Price | Days on Market | Active Listings | YoY Change | Supply Note |
|---|---|---|---|---|---|
| Carmel Arts & Design District | $630K | ~22 | ~370 | +4.7% | Inventory up ~21% year over year (Realtor.com, April 2026); still a fast market |
| Fishers Innovation & Geist | $427K | ~20 | ~480 | +1.7% | Very low supply near 0.6 months (Houzeo); about 3 offers per home (Redfin) |
| Noblesville Historic Square & Morse Lake | $417K | ~18 | ~255 to 410 | +8.4% | About 1.3 months of supply (Houzeo); 255 to 410 MLS listings in July 2026 |
| Westfield Grand Park & Restaurant Row | $495K | 13 | ~280 | +4.2% | 153 sales in the latest Redfin month (May 2026); price readings vary by source |
| Zionsville Brick-Paved Village Charm | $750K | 9 | ~190 to 225 | +5.3% | Region's premium tier; median list near $749K (Movoto, August 2026) |
| Whitestown Growth Hub & Railroad Heritage | $390K | ~71 | ~190 to 250 | -1.3% | Cooling from its 2025 peak as new-build inventory grows along I-65 |
Carmel
Arts & Design District
Fishers
Innovation & Geist
Noblesville
Historic Square & Morse Lake
Westfield
Grand Park & Restaurant Row
Zionsville
Brick-Paved Village Charm
Whitestown
Growth Hub & Railroad Heritage
Detailed City-by-City Breakdown
Deep dive into each community's market dynamics, key neighborhoods, and what the numbers mean for buyers and sellers.
Carmel
Arts & Design District
Carmel remains the county's premium market. Movoto's June 2026 snapshot put the median sold price near $629,900 on 356 sales, while Redfin's three-month median through April 2026 was about $550,000, up 4.7% year over year, and Zillow's average home value rose 4.6%. Homes near the Arts & Design District and top Carmel Clay elementary schools still command top dollar. Inventory is climbing, with Realtor.com counting 383 active listings in April 2026, up 21.4% from a year earlier, but well-staged, correctly priced homes continue to sell within a week or two.
Fishers
Innovation & Geist
Fishers shows modest year-over-year growth as its market settles from the post-pandemic peak. Redfin's three months ending May 2026 put the median sale price near $427,000, up 1.7% year over year, with homes selling in roughly 20 days and drawing about three offers each. Redfin counted about 480 active listings as of late September 2026, far more choice than buyers had a year ago. The Nickel Plate District and Geist Reservoir waterfront remain the hottest sub-markets, and correctly priced homes still move quickly while overpriced listings sit longer.
Noblesville
Historic Square & Morse Lake
Noblesville is one of the county's stronger 2026 markets, with Redfin's three months ending June 2026 showing a median sale price near $417,000, up 8.4% year over year, and about 18 to 19 median days on market. A June 2026 broker snapshot reported 115 homes sold in the month at an average of 29 days on market, with about 1.3 months of supply. The historic downtown and Morse Reservoir lifestyle continue to draw buyers without the Carmel price premium, and new construction keeps the entry and trade-up segments active.
Westfield
Grand Park & Restaurant Row
Westfield's strong appreciation is driven by the Grand Park Sports Campus and its growing reputation as a dining destination. A July 2026 snapshot of Redfin data put the median sale price near $495,000 for the month ending May 2026, up 4.2% year over year, with a median of 13 days on market and 153 sales. MLS feeds counted about 279 active listings in July 2026. New construction in communities like Chatham Hills and Serenade pushes the median upward, and competitive pricing still matters, since the pace of appreciation varies sharply by neighborhood.
Zionsville
Brick-Paved Village Charm
Zionsville commands the highest price points in the region, reflecting its iconic brick-paved Main Street, boutique village atmosphere, and top-ranked Boone Community Schools. Redfin's three months ending July 2026 put the median sale price near $750,000, up 5.3% year over year, with a median of just 9 days on market and an 85 out of 100 competitiveness score. Movoto counted roughly 192 to 224 active listings in August 2026 with a median list price near $749,000. Tight luxury inventory keeps this Boone County village in a seller-favourable position even as the broader market cools.
Whitestown
Growth Hub & Railroad Heritage
Whitestown's market has cooled from its 2025 peak. Redfin put the median sale price near $390,000, down about 1.3% year over year, while Movoto's July 2026 snapshot showed a median sold price of $373,900 with average days on market of 71, up from 56 a year earlier, and roughly 189 to 252 active listings. New construction along the I-65 corridor creates buyer options that temper resale pricing, keeping Whitestown one of the most affordable entry points in the region with easy access into Indianapolis.
Three Key Trends to Watch
County Median Up 3.7% to $520,500
The Hamilton County median sale price reached $520,500 in the June 2026 MIBOR report, up 3.7% year over year. F.C. Tucker's Market Watch puts the county's 2026 year-to-date median near $474,900, the highest of any county in central Indiana, with price per square foot around $183, up 4.6%.
Inventory Near a Decade High: Buyer Choice Is Back
Available inventory in the 16-county central Indiana region tracked by MIBOR and F.C. Tucker is near 8,000 homes, the highest in almost a decade and up about 20% year over year. Hamilton County itself holds 818 active listings with 1.2 months of supply, up from 726 listings in May.
Rates Crossed 7% in Late September
The 30-year fixed mortgage averaged 7.03% for the week ending September 24, 2026, per Freddie Mac's Primary Mortgage Market Survey, up from 6.65% in late August. Higher rates squeeze monthly payments, but they also hand buyers leverage as sellers respond with price adjustments, rate buydowns, and closing-cost concessions.
What This Means for You
If You're a Buyer
With 818 active listings, 1.2 months of supply, and the county median near $520,500, buyers have more choice than in almost a decade, though the pace still varies by city. In premium markets like Carmel and Zionsville, well-priced homes still attract multiple offers within days. In Noblesville, Westfield, and Whitestown, larger inventories and longer days on market mean more room to negotiate price, rate buydowns, and closing costs. Move quickly on the right home, get pre-approved early, and work with an agent who can identify off-market opportunities.
If You're a Seller
Rates near 7% have shifted leverage toward buyers, so pricing accuracy matters more than ever. The county's 1.2 months of supply is still seller-favourable, and homes that are properly staged, competitively priced, and marketed aggressively in the first two weeks still sell quickly, especially in Carmel, Fishers, and Zionsville. Homes priced from day one against today's competition generate the showings and offers that a slow, weekly price reduction never recovers.
If You're a Homeowner
Your Hamilton County property has appreciated steadily: the county median is up 3.7% year over year to $520,500, and the 2026 year-to-date median near $474,900 is the highest of any county in central Indiana per F.C. Tucker. Carmel and Zionsville homes in desirable school sub-districts continue to hold premium value, and price per square foot is up about 4.6% year over year.
Data Sources & Methodology
Market statistics in this report are drawn from the June 2026 MIBOR Market Insights monthly report for Hamilton County single-family homes (the most recent county-level MIBOR dataset published as of this update), F.C. Tucker Company's Market Watch (July 2026, including the county's year-to-date median near $474,900), Freddie Mac's Primary Mortgage Market Survey (week ending September 24, 2026), and the latest dated city-level snapshots from Redfin, Movoto, Zillow, Houzeo, and local MLS feeds, covering June through September 2026. Median sale prices reflect closed transactions and may differ from listing prices. County days on market are averages; city figures are medians unless noted. Inventory counts are point-in-time snapshots and fluctuate daily.
This report is intended for informational purposes only and does not constitute a formal appraisal or guaranteed market prediction. For a personalized valuation of your specific property, please contact Susan Roberts directly.
What Do These Numbers Mean for Your Move?
Whether you're eyeing a specific neighborhood, considering selling, or just want to understand your home's current value, a quick conversation can give you clarity. No pressure — just straight talk from someone who knows every street in this county.