Where Indiana Stands: Housing Affordability & Market Trends for Late July 2026
As we close July 2026, Indiana's housing market shows a clear divide: the state remains one of the most affordable in the nation, yet affordability for middle-income buyers is shrinking. Here is what the latest data means for Hamilton County and Boone County homebuyers, sellers, and homeowners, with expert perspective from local Associate Broker Susan Roberts.

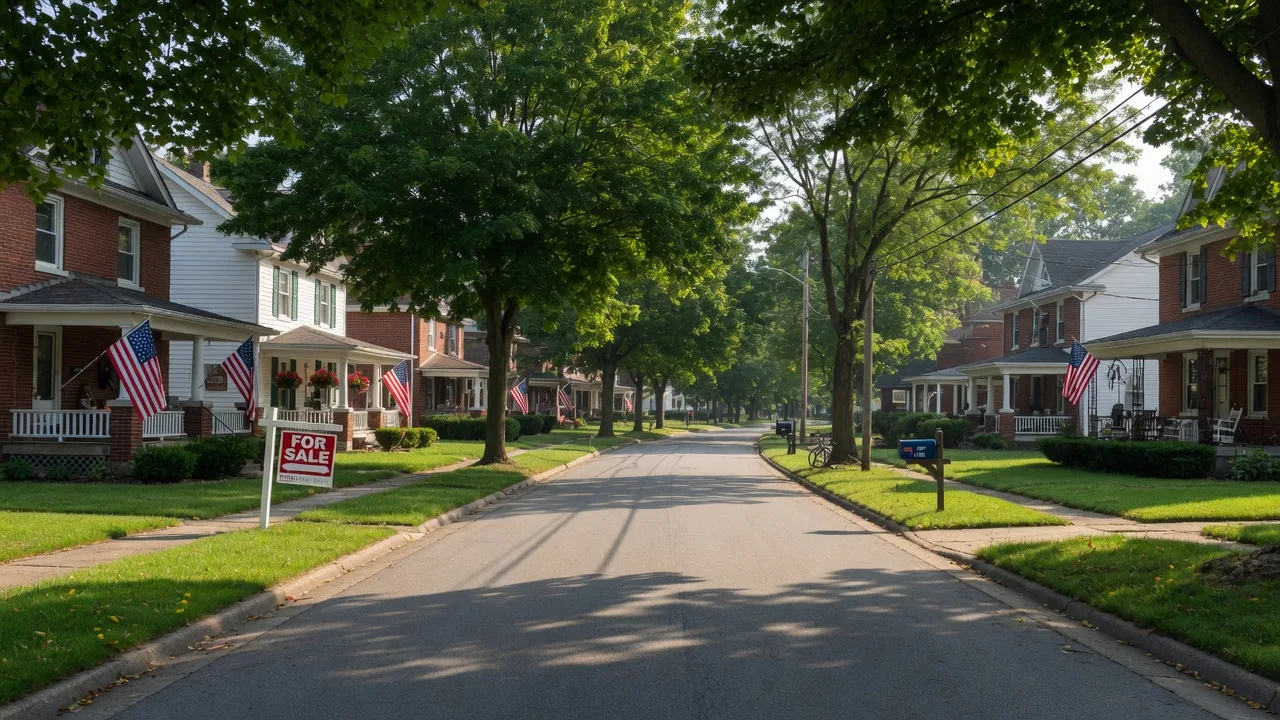
The Housing Market Right Now
Late July 2026 data. Sources: Freddie Mac, NAR, Indiana Association of Realtors, MIBOR.
The housing market in Indiana and across the nation continues to navigate a period of adjustment in mid-2026. Mortgage rates have stabilized in the upper 6% range after falling from their 2025 peak, home prices are at or near all-time highs in many markets, and inventory is slowly improving. But beneath these broad trends lies a more nuanced story about affordability — particularly for first-time buyers and middle-income families.
In this update, I break down the most recent data on mortgage rates, home prices, inventory, and buyer demand, with a focus on what it all means for Hamilton County and Boone County residents. Whether you are planning to buy, sell, or simply keep an eye on your home's value, understanding where we are in the cycle is the first step to making informed decisions.
Rates near 6.58% as the market stabilizes from 2025 highs
The 30-year fixed mortgage rate averaged 6.58% as of July 23, 2026, according to Freddie Mac's weekly Primary Mortgage Market Survey. That rate has remained relatively steady throughout July, hovering between 6.43% and 6.75% depending on the lender and loan program. The 15-year fixed rate sits near 5.77%, while jumbo loans continue to carry a modest premium.
These rates, while nearly double the pandemic-era lows, represent meaningful improvement from the 2025 peak of approximately 7.6%. For a buyer financing $400,000, the difference is roughly $275 per month in principal and interest — savings that can make or break a homebuying budget. The question on everyone's mind: will rates continue to drift lower in the fall, or will they hold steady?
My take for Hamilton County buyers: Waiting for rates to drop to 5% before buying is a risky strategy. The Federal Reserve has signaled it is in no hurry to cut rates significantly while the economy remains resilient. If you find a home that fits your needs and budget at today's rates, you can always refinance when rates eventually decline. What you cannot get back is the appreciation you may miss while waiting on the sidelines.
Indiana's strong first half reveals a two-speed market
The Indiana Association of Realtors released its mid-year 2026 report on July 14, and the data shows a state with robust sales activity but growing affordability concerns. Here are the key takeaways:
Sales volume is strong
Nearly 39,000 homes were sold across Indiana in the first half of 2026, the strongest first-half total since 2022. That is a clear indicator that buyer demand has rebounded as mortgage rates stabilized and consumers adjusted to the new normal of 6-7% rates. The return of buyer confidence is a positive signal for the fall market.
Prices continue to climb
The statewide median home price reached $290,000 in June, up 4.5% year-over-year. Over the past five years, Indiana home prices have surged 44%, far outpacing wage growth. The H1 2026 median of $275,000 is well below the national figure but represents a significant increase from the $190,000 median recorded just five years ago.
The middle-market squeeze is real
The most concerning data point from the mid-year report: only 36% of Indiana listings are now affordable for middle-income households. Homes priced under $250,000 — the sweet spot for first-time buyers and many working families — have become scarce, with sales volume declining in that segment. This shortage of entry-level inventory is the single biggest challenge facing the Indiana housing market today.
New listings are up, giving buyers more choice
A bright spot: new listings reached 54,106 in the first half of 2026, up 5% year-over-year. That increase, while modest, is meaningful for buyers who have been frustrated by limited options. The additional inventory has also helped push the average days on market to 20 days statewide, up from 17 days in H1 2025 — still brisk, but giving buyers slightly more time to make thoughtful decisions.
The three numbers that define Indiana's affordability story
Indiana is one of the most affordable states in the country
With a statewide median price of $290,000 in June 2026, Indiana remains far below the national median of $440,600. That is roughly 34% below the national figure, giving Indiana buyers significantly more purchasing power. A household earning the state median income of roughly $67,000 can afford a home near the $275,000 price point — considerably more attainable than in coastal markets where median prices routinely exceed $700,000.
But affordability is eroding for middle-income households
According to the Indiana Association of Realtors mid-year report, only 36% of Indiana listings are now affordable for middle-income families — down from over 50% just a few years ago. Home prices have risen 44% over the past five years, far outpacing wage growth. Homes under $250,000 are becoming increasingly scarce, and sales volume in that price band has declined as inventory dries up.
Hamilton County commands a significant premium
Hamilton County's median sale price exceeds $500,000 — roughly 72% above the statewide median. That premium reflects the county's top-ranked schools, low crime rates, robust job growth, and quality-of-life amenities that consistently attract relocating families from across the country. While the price premium is steep, Hamilton County homes also tend to hold value better during market corrections.
Hamilton County: Premium pricing for premium lifestyle
While Indiana's statewide median of $290,000 tells an affordability story, Hamilton County operates in a different price tier. Our county's median sale price exceeds $500,000, which is roughly 72% above the state median. That premium is not arbitrary — it reflects the real value buyers place on Hamilton County's top-rated school systems, low crime rates, extensive parks and trail networks, and thriving downtown districts.
For context, here is how each community stacks up:
- Carmel: Median prices in the $550K-$600K range. The Arts & Design District and top-ranked Carmel Clay Schools drive persistent demand. Inventory remains extremely tight, with well-priced homes often receiving multiple offers within the first week.
- Fishers: Median around $475K-$500K. The Nickel Plate District and strong job growth from the Fishers District expansion continue to attract relocating families and young professionals.
- Westfield: Median around $500K-$520K. Grand Park Sports Campus and the growing Restaurant Row on Park Street make Westfield a draw for both families and active adults seeking new-construction options.
- Noblesville: Median in the $440K-$460K range. Historic downtown, Morse Reservoir access, and the new Finch Creek by Del Webb campus create a balanced market with good value for buyers.
- Zionsville (Boone County): Median $550K-$600K. The brick-paved Main Street, Zionsville Community Schools, and village atmosphere command the highest prices in the region. Limited inventory keeps competition strong.
- Whitestown (Boone County): Median around $400K-$425K. The most affordable entry point among featured communities. Rapidly growing with new construction and easy I-65 access.
The bottom line: Hamilton County remains a seller's market with roughly 1.2 months of inventory county-wide. That is not as extreme as the sub-one-month levels of 2021-2022, but it still favors sellers in most price segments. Buyers should expect competition for well-priced, well-located homes and come prepared with pre-approval and a clear strategy.
Practical advice for late summer 2026
For buyers
- Get pre-approved early. In Hamilton County's competitive market, a pre-approval letter from a local lender signals to sellers that you are a serious, qualified buyer. Sellers' agents know which local lenders close on time.
- Expand your search area. If Carmel or Zionsville feel out of reach, consider Noblesville or Whitestown. Both offer strong school systems and growing amenities at more accessible price points.
- Explore new construction. Builders are offering rate buydowns, closing cost credits, and upgrade packages. A 2-1 buydown can reduce your effective rate significantly in the first two years.
- Consider fixer-uppers. Homes that need cosmetic updates often sit longer and can be negotiated below market value. With a renovation loan like an FHA 203(k), you can roll the improvement costs into your mortgage.
For sellers
- Price accurately from day one. Homes priced within 2-3% of market value sell faster and for closer to asking price. Overpricing by 5-10% often leads to a stale listing, price reductions, and weaker final terms.
- Stage and photograph professionally. In a market with growing inventory, the homes that stand out sell first. Professional photography, virtual tours, and strategic staging are the minimum standard, not optional extras.
- Highlight what makes your home unique. School district proximity, walkability to downtown, updated kitchens, energy-efficient features, and neighborhood amenities all matter to today's buyers.
- Be flexible on terms. Offering a closing cost credit, a home warranty, or a flexible possession date can make your listing more attractive than a similar home priced slightly lower but with no concessions.
What to watch in the second half of 2026
As we look ahead to the fall market, several factors will shape housing activity in Hamilton County and across Indiana:
- The Fed's next moves. The Federal Open Market Committee meets July 29-30, with markets widely expecting rates to hold steady. Any signals about future rate cuts will influence mortgage rate direction. If inflation continues to cool, the Fed may signal a cut in late 2026, which could bring mortgage rates down to the 6% range.
- Builder sentiment and new construction. The NAHB Housing Market Index showed builder sentiment at 34 in July — in negative territory but stable. As long as builders remain cautious about new starts, the supply deficit will persist, supporting home prices at current levels.
- The 21st Century ROAD to Housing Act. The recently passed federal legislation includes more than 40 supply-side provisions aimed at boosting housing construction, streamlining permitting, and expanding workforce housing tax credits. While the impact will take years, it signals a serious federal commitment to addressing the housing shortage.
- Seasonal patterns. August through October historically sees strong buyer activity as families aim to close before the school year or settle before the holidays. In Hamilton County, that seasonal uptick could tighten inventory further in the most desirable price bands.
My overall outlook for Hamilton County: a market that is gradually normalizing from the pandemic-era extremes, but one that still favors sellers in most segments. Prices are likely to appreciate modestly through the remainder of 2026 — in the 2-4% range — as long as job growth and in-migration remain healthy.
Sources & Methodology
Mortgage rate data from Freddie Mac Primary Mortgage Market Survey (July 23, 2026). National home price and inventory data from the National Association of Realtors Existing Home Sales report and Redfin Housing Market Tracker (July 2026). Indiana-specific data from the Indiana Association of Realtors Mid-Year 2026 Housing Report (July 14, 2026), Indianapolis Star coverage (July 14, 2026), and Eagle Country 99.3 reporting (July 15, 2026). Hamilton County city-by-city estimates based on MIBOR Market Insights and local MLS trend data. Builder sentiment from NAHB/Wells Fargo Housing Market Index (July 2026).
This article is intended for informational purposes only and does not constitute financial, lending, or investment advice. Home prices, mortgage rates, and market conditions change frequently. Consult a licensed mortgage professional for current rate quotes and a real estate professional for market-specific advice tailored to your situation.
What Do These Numbers Mean for You?
Every market statistic represents a real opportunity or a real challenge for someone. If you are trying to figure out where you fit in today's market, I would love to help. A 30-minute conversation can clarify your options and give you a practical plan — whether you are buying, selling, or just exploring.