Fall 2026 Market Update: Pending Sales Steady as Home Prices Keep Climbing
The first full week of fall brought a quieter kind of market news: pending sales holding roughly steady month over month, home prices still climbing in Indiana and across the country, and mortgage rates holding near 6.95%. Here is the late September 2026 housing market update and what it means for buyers and sellers in Hamilton and Boone County, from local Associate Broker Susan Roberts.

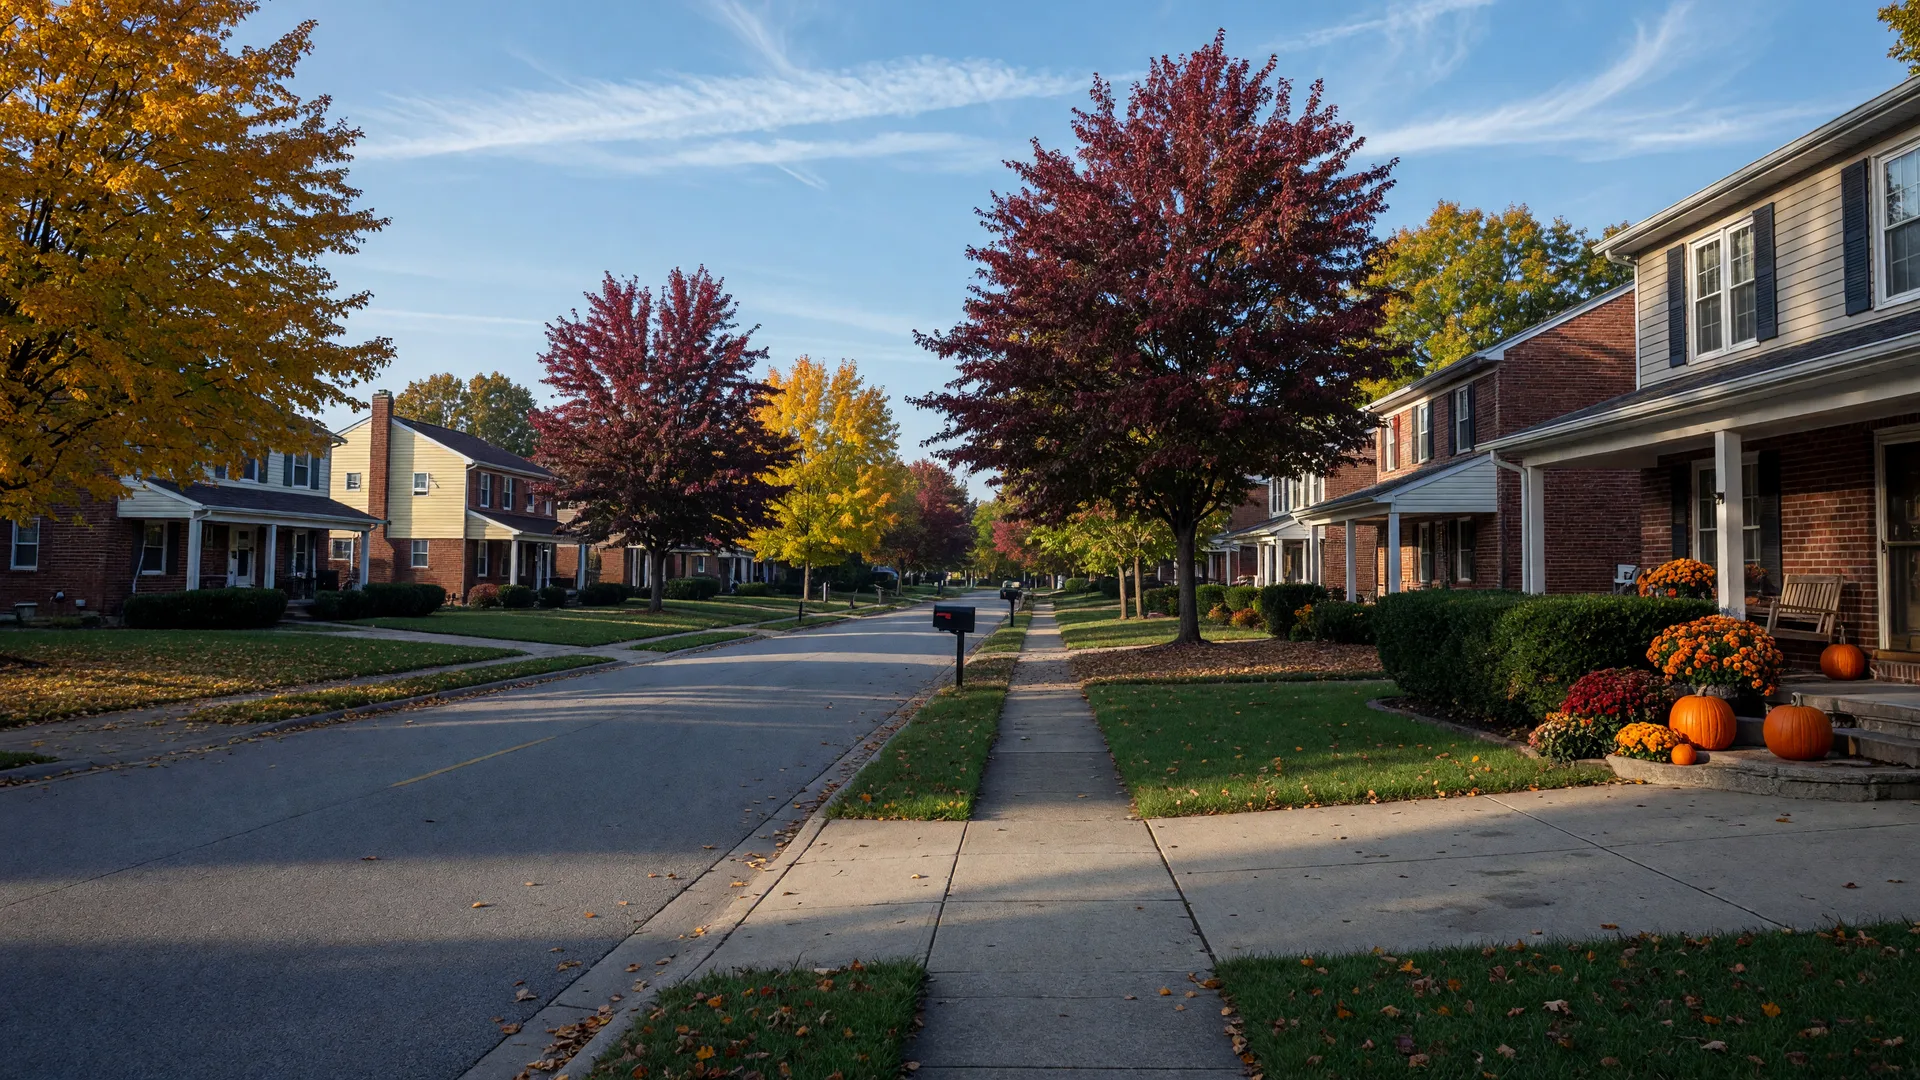
The market right now
Data as of late September 2026. Sources: Freddie Mac Primary Mortgage Market Survey, National Association of Realtors, Federal Housing Finance Agency, Redfin, Indiana Association of Realtors.
The late September housing picture is one of stabilization rather than drama. The National Association of Realtors reported its August pending-home-sales index rose 0.3% month over month, a small but meaningful bounce after two straight monthly declines, even as contract signings ran 4.7% below a year ago. Mortgage rates held near 6.95% per Freddie Mac's September 17 survey, and home prices kept their slow, steady climb: the FHFA all-transactions index for Indiana reached 538.71 in Q2 2026, up roughly 4.6% year over year.
For local readers, the numbers that matter most are the local ones. Hamilton County's year-to-date median holds near $474,900, far above Indiana's statewide median, while Redfin's metro Indianapolis data show the median near $260,000 with homes selling in about 24 days. Boone County's Zionsville continues to trade in its own premium tier. Here is the full late-September roundup, what the pending-sales data say about the fall market, and how to position yourself in Hamilton and Boone County over the next several weeks.
Pending sales steady as buyers test the market
NAR's pending-home-sales index, which tracks signed contracts rather than closings, rose 0.3% in August after two consecutive monthly declines. The signal is modest: demand is no longer falling, but it is also not snapping back. Contracts ran 4.7% below August 2025, and the Midwest, which includes Indiana, was among the regions where contract activity stayed softest on a year-over-year basis.
What the index does tell us is that the market has found a lower floor and is settling onto it. Buyers who are active are serious, rate-pre-approved, and selective. That is exactly the environment where prepared local buyers can negotiate price, repairs, and closing costs far more effectively than they could in the low-inventory years. The next real test of demand is the pending-sales report for September and NAR's September existing-home sales report, due October 13.
Prices keep climbing even as volume cools
The defining feature of this cycle remains price stability. Nationally, the median existing-home price hit $429,100 in August, up 1.6% year over year. The FHFA all-transactions House Price Index shows Indiana at 538.71 in Q2 2026, up from 529.17 in Q1 and roughly 4.6% above the same quarter a year earlier, with the next quarterly update scheduled for September 29.
Metro Indianapolis data from Redfin put the city median near $260,000, up about 3.9% year over year, with homes going pending in roughly 24 days. That is a different world from the county's numbers: Hamilton County's year-to-date median holds near $474,900, supported by Carmel, Fishers, and Noblesville's premium corridors, and homes there sell faster and with less price negotiation than the metro average. In Boone County, Zionsville's brick-paved Main Street, Russell Oaks lakefront, and strong schools keep that city in a tier most metro buyers cannot touch. The takeaway: Indiana's steady statewide price growth understates how strongly the northern suburbs have held, and how much value still exists a short drive from the county line.
Rates hold near 7% and lenders are watching the same charts
Freddie Mac's Primary Mortgage Market Survey put the 30-year fixed rate at 6.95% for the week ending September 17, the third consecutive weekly rise and the highest reading since January 2025. The 15-year fixed averaged 6.26%. A year ago the 30-year stood at 6.26%, so the run-up in borrowing costs is the single biggest force shaping buyer behavior this fall.
What it means for your payment: at current county price levels, each quarter-point of rate moves the monthly payment by roughly $60 to $90 per $100,000 borrowed, which is why buyers at the $400,000 to $500,000 range feel the difference between a 6.5% and a 7.0% quote so acutely. The Federal Reserve has held its target range at 3.50% to 3.75% through the September meeting, and the market consensus is for mortgage rates to stay elevated into year-end rather than drop sharply. That argues for locking a workable number when you find it instead of waiting for a headline rate cut.
How to buy well in a 6.95% fall market
Lock when the number works, not when the headline changes
With the 30-year at 6.95% and 15-year at 6.26%, a rate near 7% is now the working assumption, not a scare headline. If a lender can lock a payment that fits your budget, take the certainty and let price, terms, and seller concessions carry the rest of the negotiation.
Lean into the deeper inventory
National supply sits near a 4.9-month level, the most choice buyers have seen in over a decade. In Hamilton and Boone County, that shows up as price adjustments, longer days on market, and seller credits. Tour a broader range of homes than you planned; the right option is often one you would not have seen two years ago.
Stack builder incentives against resale value
Across Westfield, Whitestown, Noblesville, and Fishers, builders are pairing rate buydowns and closing-cost help with new construction. Run the true monthly cost of a new build against an updated resale in the same corridor before you default to either one.
Get pre-approved before you tour
A county median near $474,900 means every tenth of a point matters on your payment. A current pre-approval shows sellers you are serious and lets you move the day the right home appears instead of losing it to a buyer who was ready.
How to sell well with deeper inventory in the market
Price against today's competition, not last year's
Buyers have roughly twice the choice they had in the sprint years. Homes priced from day one to match the newest comps generate the showings and offers that a slow, weekly price reduction never recovers. Your first two weeks of traffic are the market telling you the truth.
Lead with condition and the numbers buyers care about
With rates near 7%, buyers underwrite payments, taxes, and likely repairs before they write an offer. Fresh paint, clean light, updated mechanicals, and a tidy exterior make underwriting easy. Consider ordering pre-listing inspections so there are no surprises at the closing table.
Plan for a patient, healthy timeline
Days on market are longer than the 2021 sprint, and that is a normal rhythm. Budget a few extra weeks and hold your pricing strategy steady instead of chasing every lowball. Sellers who stay disciplined through weeks two and three consistently land better numbers than sellers who panic in week one.
Use concessions as a negotiation tool, not a giveaway
A temporary rate buydown or a modest closing-cost credit can bridge the gap between a buyer's payment ceiling and your list price. Structured well, you protect your net while the buyer walks away with terms they can say yes to.
What to watch next for Hamilton and Boone County
Three dates mark the next chapter. On September 29, the FHFA releases its Q3 house-price index reading, the first fresh confirmation of whether Indiana prices held their 4.6% pace. On October 13, NAR publishes September existing-home sales, the first look at whether the market settles at its new, lower volume or keeps sliding. Between them, keep an eye on the weekly Freddie Mac survey for any drift in the 30-year rate around the Fed's messaging into year-end.
Locally, the fall listing cycle is in full swing: families have settled into the school year, leaves are turning, and fresh inventory is arriving across Fishers, Carmel, Noblesville, Westfield, and Boone County. Deeper inventory plus rate-sensitive buyers means pricing and presentation matter more now than at any point in years. My Hamilton County market report tracks the city-by-city medians, days on market, and inventory each cycle, and the Local Journal carries the weekly news, including my late September rates and inventory roundup.
If you are weighing whether to buy now, list this fall, or wait for year-end, the past two weeks of data actually make the decision easier: rates are not about to collapse, prices are not about to drop, and the county's premium corridors still reward prepared buyers. I track every cycle and would be glad to walk through what the newest numbers mean for your specific plan. You can reach me anytime.
Sources
Freddie Mac Primary Mortgage Market Survey (week ending September 17, 2026). National Association of Realtors Existing-Home Sales Report (August 2026) and Pending Home Sales Index (August 2026, released September 17, 2026). Federal Housing Finance Agency All-Transactions House Price Index for Indiana (Q2 2026). Redfin Indianapolis housing market data (August 2026). Indiana Association of Realtors 2026 housing data. EverythingHamiltonCounty.com Market Report and prior 2026 market updates.
This article is for informational purposes only and does not constitute financial, lending, or investment advice. Consult a licensed mortgage professional for personalized rate quotes and a real estate professional for market-specific guidance.
Make the Fall Market Work for You
Whether you are buying into deeper inventory with real negotiating room or selling into one of the strongest appreciation corridors in the Midwest, a quick conversation can give you clarity. No pressure, just straight talk from a 25-year veteran of Hamilton and Boone County real estate.